Glucose sensing for a jet injector
Kylie ClampittSupervisors: A/Prof Andrew Taberner & Dr Bryan Ruddy
Then
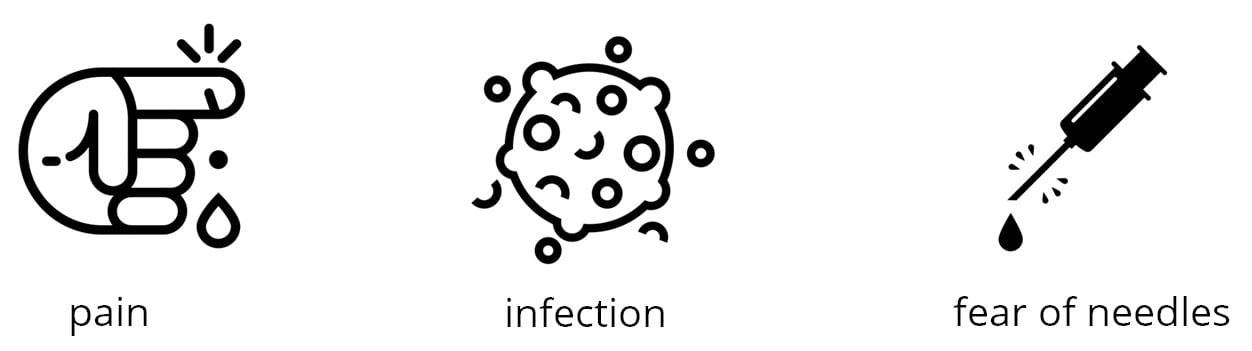
Diabetics must monitor their blood glucose up to four times a day to avoid long-term damage to vital organs. They require a portable and inexpensive device capable of measuring their glucose levels throughout the day. The most popular method is using a needle or lancet to pierce the skin and draw blood. A glucometer then analyses this blood and records the patient’s blood glucose level. Achieving patient compliance is difficult for the reasons stated below. For this reason, researchers are looking into alternative methods to draw blood from the skin.
Now?
Needle-free jet injection may soon become a reality. The ABI is currently developing a custom jet-injection device in which a Lorentz force actuator allows real-time control over the delivery of fluid into the skin. Once the fluid pierces the skin, the actuator reverses the direction of the piston in order to withdraw blood from the patient. However, this process intermixes blood with injectate fluid, leaving the extracted blood diluted to a smaller concentration than a commercial glucometer is able to measure.
Therefore, my project partner worked on a device able to measure blood glucose concentration in a diluted solution. The focus of my project was to design and construct a benchtop system for measuring blood dilution in a needle-free jet injector.
How?
- We can determine the blood dilution factor by tracking the concentration of either injectate fluid or blood during the extraction process. The properties of blood vary among individuals, hence why we track injectate fluid using some kind of marker.
- Fluorescent markers, called fluorophores, were selected as they are both fast and non-invasive. Fluorophores re-emit light, or fluoresce, upon excitation.
Fluorophores
The fluorescent properties of sodium fluorescein were tested prior to the start of this project. This fluorophore was ultimately rejected because blood absorbs too much light at its peak excitation wavelength, resulting in a weaker fluorescent signal. Indocyanine Green (ICG) was selected instead as it is excited in the near-IR range. Near-IR light is invisible and this presents its own challenges, as discussed in later sections.
Therefore, my project was to modify the existing benchtop system to perform fluorimetry using ICG, instead of sodium fluorescein.
Sodium Fluorescein
- Peak excitation and emission at 480 nm and 525 nm respectively
- Visible light
- High blood absorption
- Safe for intravenous use
Indocyanine Green (ICG)
- Peak excitation and emission at 780 nm and 810 nm respectively
- Invisible, near-IR light
- Minimal blood absorption
- Safe for intravenous use
Blood dilution factor = intensity of emitted fluorescence /
intensity of excitation beam
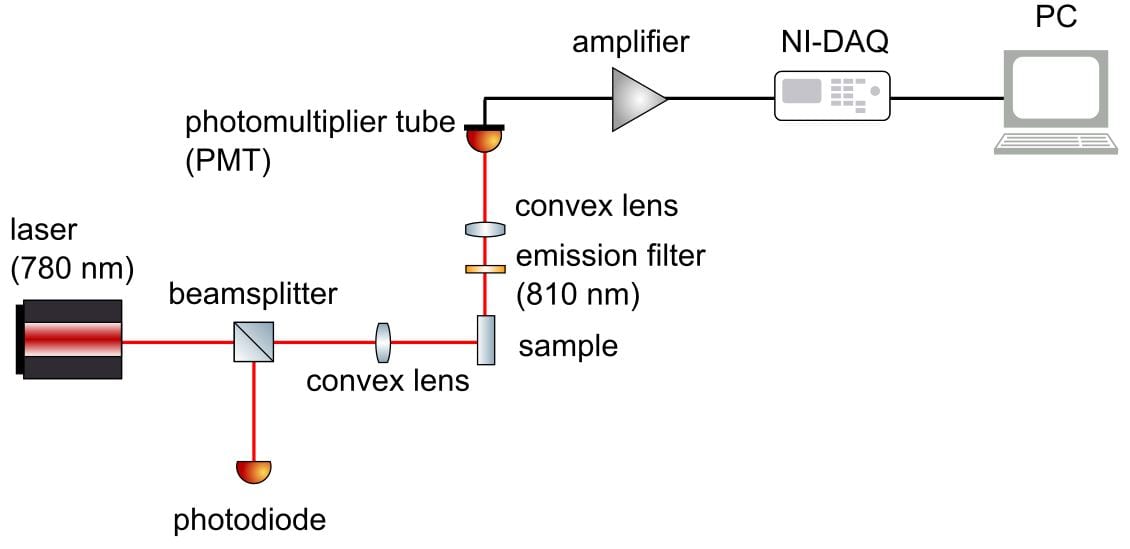
First, the light source is directed at the sample. A beamsplitter redirects some of this light towards a photodiode, which records the intensity of the excitation beam. The remaining excitation rays heads towards the sample, where it excites fluorescence from the blood-injectate mixture. The intensity of fluorescence emitted by this sample is then recorded by a photomultiplier tube. Each signal from the photodiode and photomultiplier tube is processed and visualised on the computer.
Challenges
- The power output of the laser diode has to be stepped down to 1 mW for safety reasons.
- ICG has to be excited by near-IR light, which is invisible. This makes the alignment process difficult, as I could not tell whether the laser struck the capillary just by eye.
- The photodetectors may report a false level of fluorescence if they receive ambient light. Therefore, the benchtop system should be covered from all sources of ambient light.
- The fluorescent signal is weak; therefore, amplification and filtering is a must.


Light Source
- Laser safety
- Spectral components
- Light collimation
- Laser alignment
Optical Accessories
- Beamsplitter redirects portion of light towards photodiode
- Convex lens focused all of light onto the sample
- Filter removes wavelength outside of peak emission range
- Borosilicate rectangular glass capillary holds the sample
Photodetectors
- Amplification performed at first using a prototype transimpedance amplifier and subsequently switched out for an off-the-shelf amplifier with higher accuracy
Visualisation
- Fluorescence data was recorded using LabVIEW code created for the previous fluorimeter
- First stage modulates the laser and second stage filters each photocurrent using a single tone measurement function
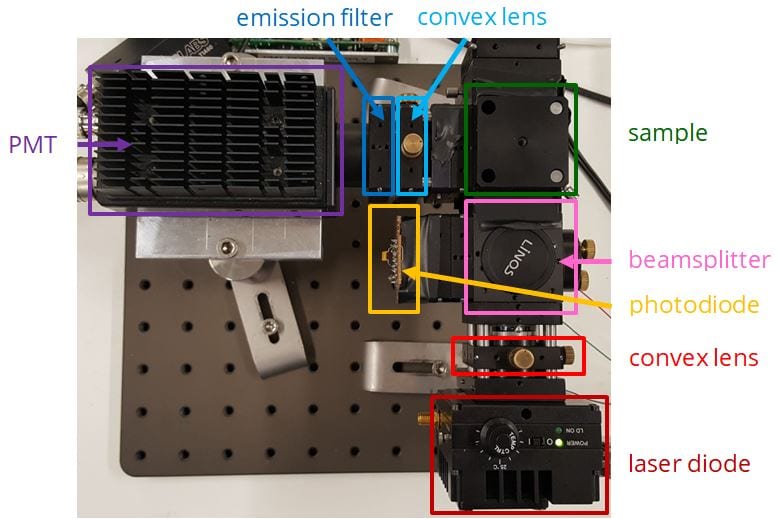
Assembly
The fluorimeter was assembled by mounting components to an optical breadboard. A black cardboard box shielded the setup from natural light.
Results
ICG was diluted in water based on a similar concentration range to that suggested in literature. Blood contains many proteins which may interfere with the fluorimetry method; hence why initial tests were conducted in water. Since water and blood have different optical properties, the concentration range of interest will likely change when testing in blood.
The first set of results failed to show a meaningful trend in fluorescence. The variability in these results may be explained by inconsistences in the cleaning protocol due to traces of ICG sticking to the wall of the capillary. The PMT may also detect light other than fluorescence, such as ambient light.
The fluorimeter was modified in order to address these issues. This modified fluorimeter is what appears in the figure above.
- Switching the laser diode for one with high precision temperature control
- Removal of the excitation filter and reduction in distance between optical components to minimise loss in signal
- Black tape completely sealed the PMT from any natural light
Subsequent results investigate the validity of the setup and measure fluorescence over different concentration ranges.
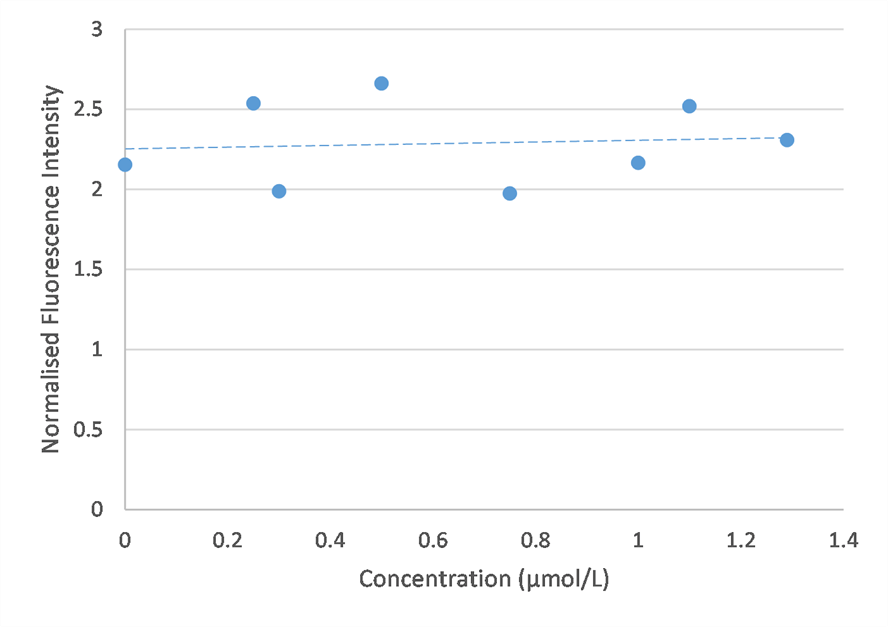
I first performed fluorimetry on samples of 0 to 1.25 umol/L ICG in water based on concentrations described in literature to see whether I could recreate the same curve.
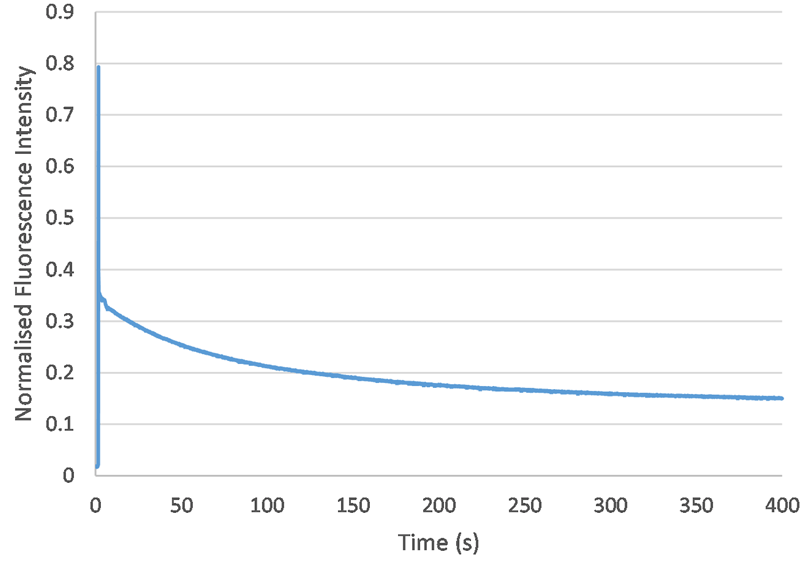
Photobleaching describes the loss in fluorescence which occurs when a sample is over-exposed to light. To investigate whether this experimental procedure was susceptible to photobleaching, I recorded the fluorescence of a 2 umol/L sample until it decayed to some steady-state value (at approximately 400 seconds). Therefore, for concentrations smaller than 2 umol/L, fluorescence data should be consistent after about 400 seconds.
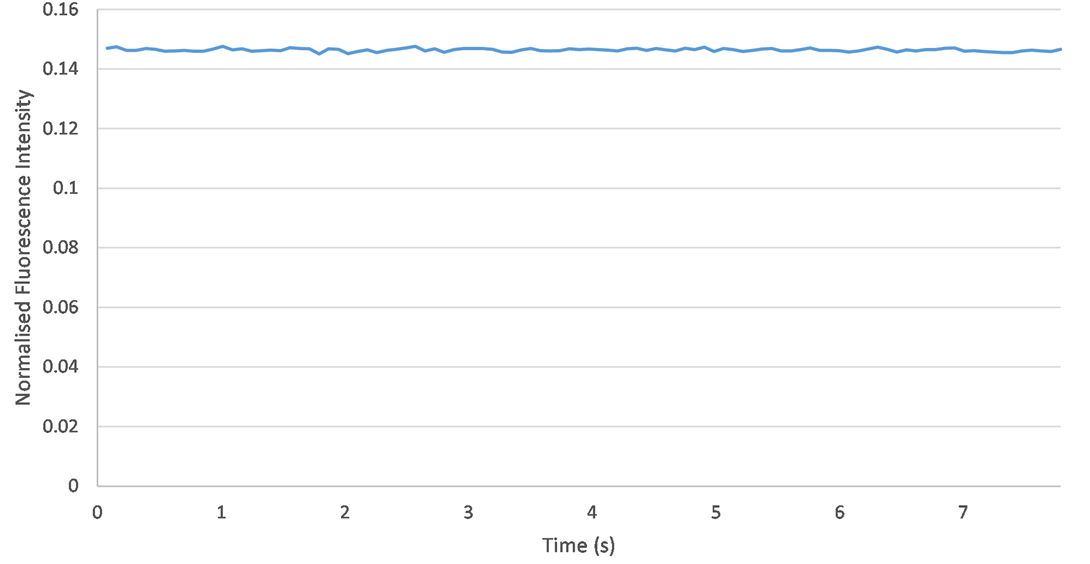
I assessed the repeatability of the experiment by collecting fluorescence data after the steady-state value was reached, using an ICG concentration of 2 umol/L. Only small fluctuations in fluorescence were observed; therefore, the experiment was considered repeatable.
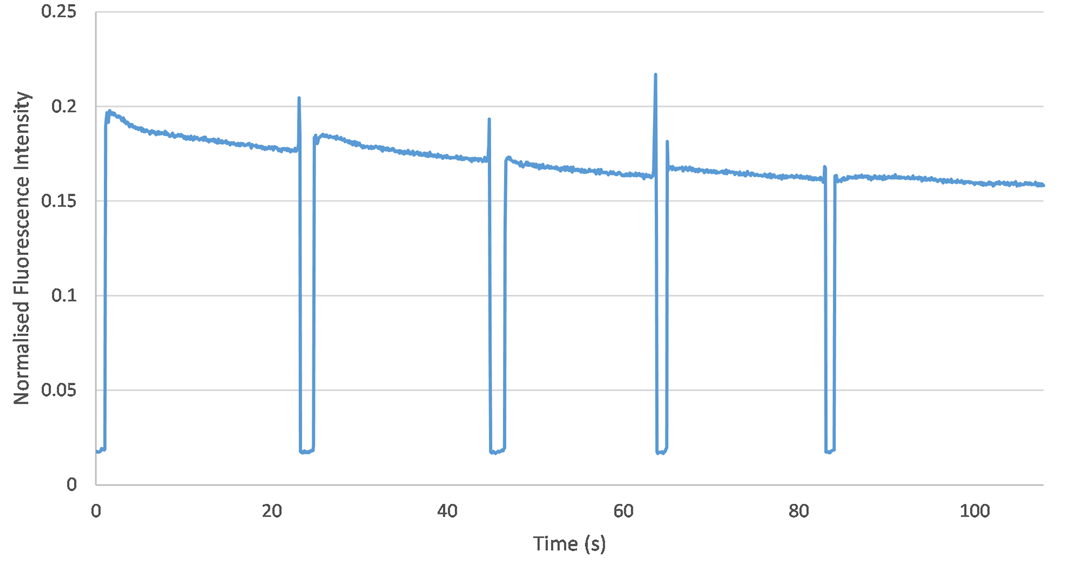
Fluorescence is very sensitive to changes in the orientation of the capillary. To assess reproducibility, I performed five experiments in a row using the same sample (with an ICG concentration of 2 umol/L). The only change I made was drawing the capillary in and out of its holder in the fluorimeter. This would test whether the orientation of the capillary may change during the experimental procedure, thus altering the fluorescence data. However, no significant change in fluorescence was observed from one experiment to the next. Therefore, it is clear that capillary orientation remains consistent across each experiment and the setup is reproducible.
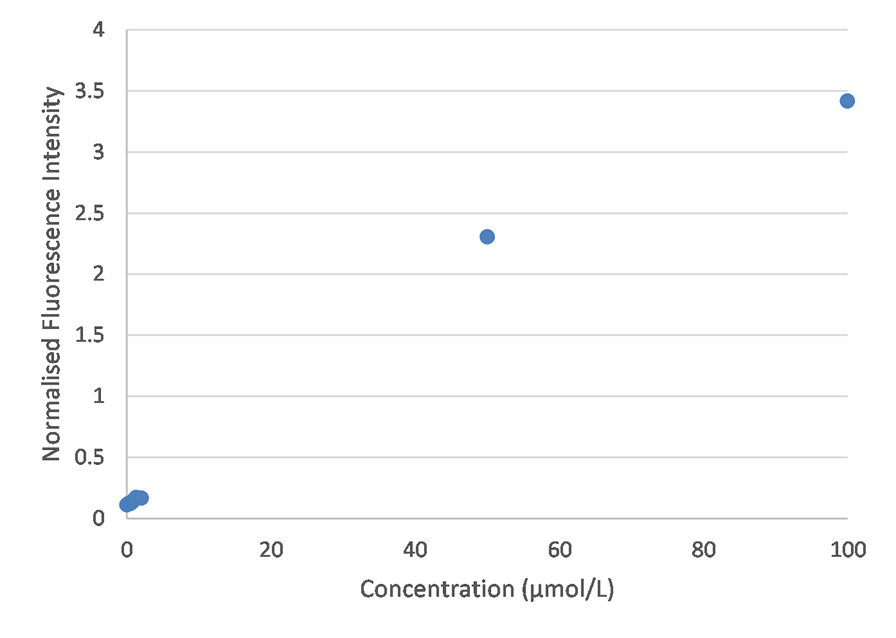
I tested a wider concentration range this time, to determine whether quenching truly did drop the fluorescence intensity, as suggested in literature. However, my results suggest that an increase in fluorescence is observed at higher concentrations. This contradicts the bell-curve shape found in literature. Future experimentation should explore the higher concentration range in greater detail.
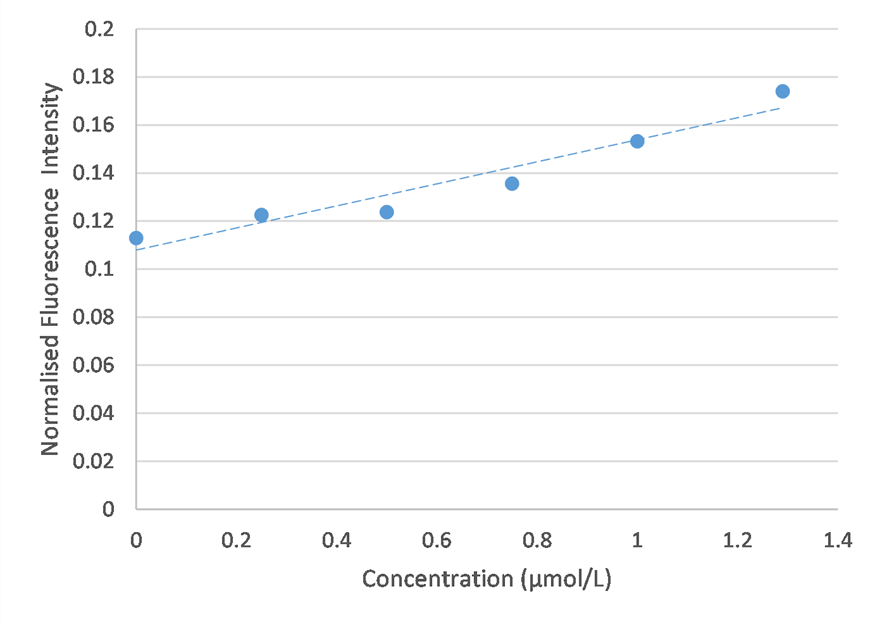
At smaller concentrations, a linear increase in fluorescence was observed. This trend matches that found in literature.
Conclusions & Future Work

Successsful modification of fluorimeter to perform fluorimetry with ICG and greater understanding of external factors which influence fluorescence
Future testing should be conducted with ICG in blood instead of water

Integration of fluorimeter with glucometer, ideally to create a miniaturised, portable device for future commercialisation