Modelling Articular Cartilage
Partnered with Georgia Heffernan
Supervised by Richard Clarke and Ashvin Thambyah
%
of women
%
of men
older than 60 years develop
osteoarthritis
people in the US alone suffer from oestoarthritis
Osteoarthritis causes severe pain and discomfort
Osteoarthsitis and Articular Cartilage
Osteoarthritis occurs due to the degeneration of articular cartilage
Nickien et al. (2017) proposed that articular cartilage degenerates in a two-step process. During the first step, the fibrils within the network decrease in interconnectivity. During the second step, they described the cartilage fibrils ‘re-aggregating.’ This is when the material undergoes a structural change on the nanoscale and the fibrils aggregate into bundles.
The Problem
Osteoarthritis is a serious problem which affects many people. To be able to treat those who suffer from osteoarthritis, the mechanism behind the degeneration of articular cartilage must be fully understood. In order to relate the nanoscale structural realities with the macroscale mechanical properties of degenerating articular cartilage, a computational model is required.
The Background
Nickien et. al (2017) performed mechanical tests on both intact and degenerate samples of articular cartilage. From these tests, they obtained the swelling potential and Young’s modulus of the samples. The graph on the right displays the results. The researchers observed a limiting stiffness retained in the cartilage samples, even with degeneration.
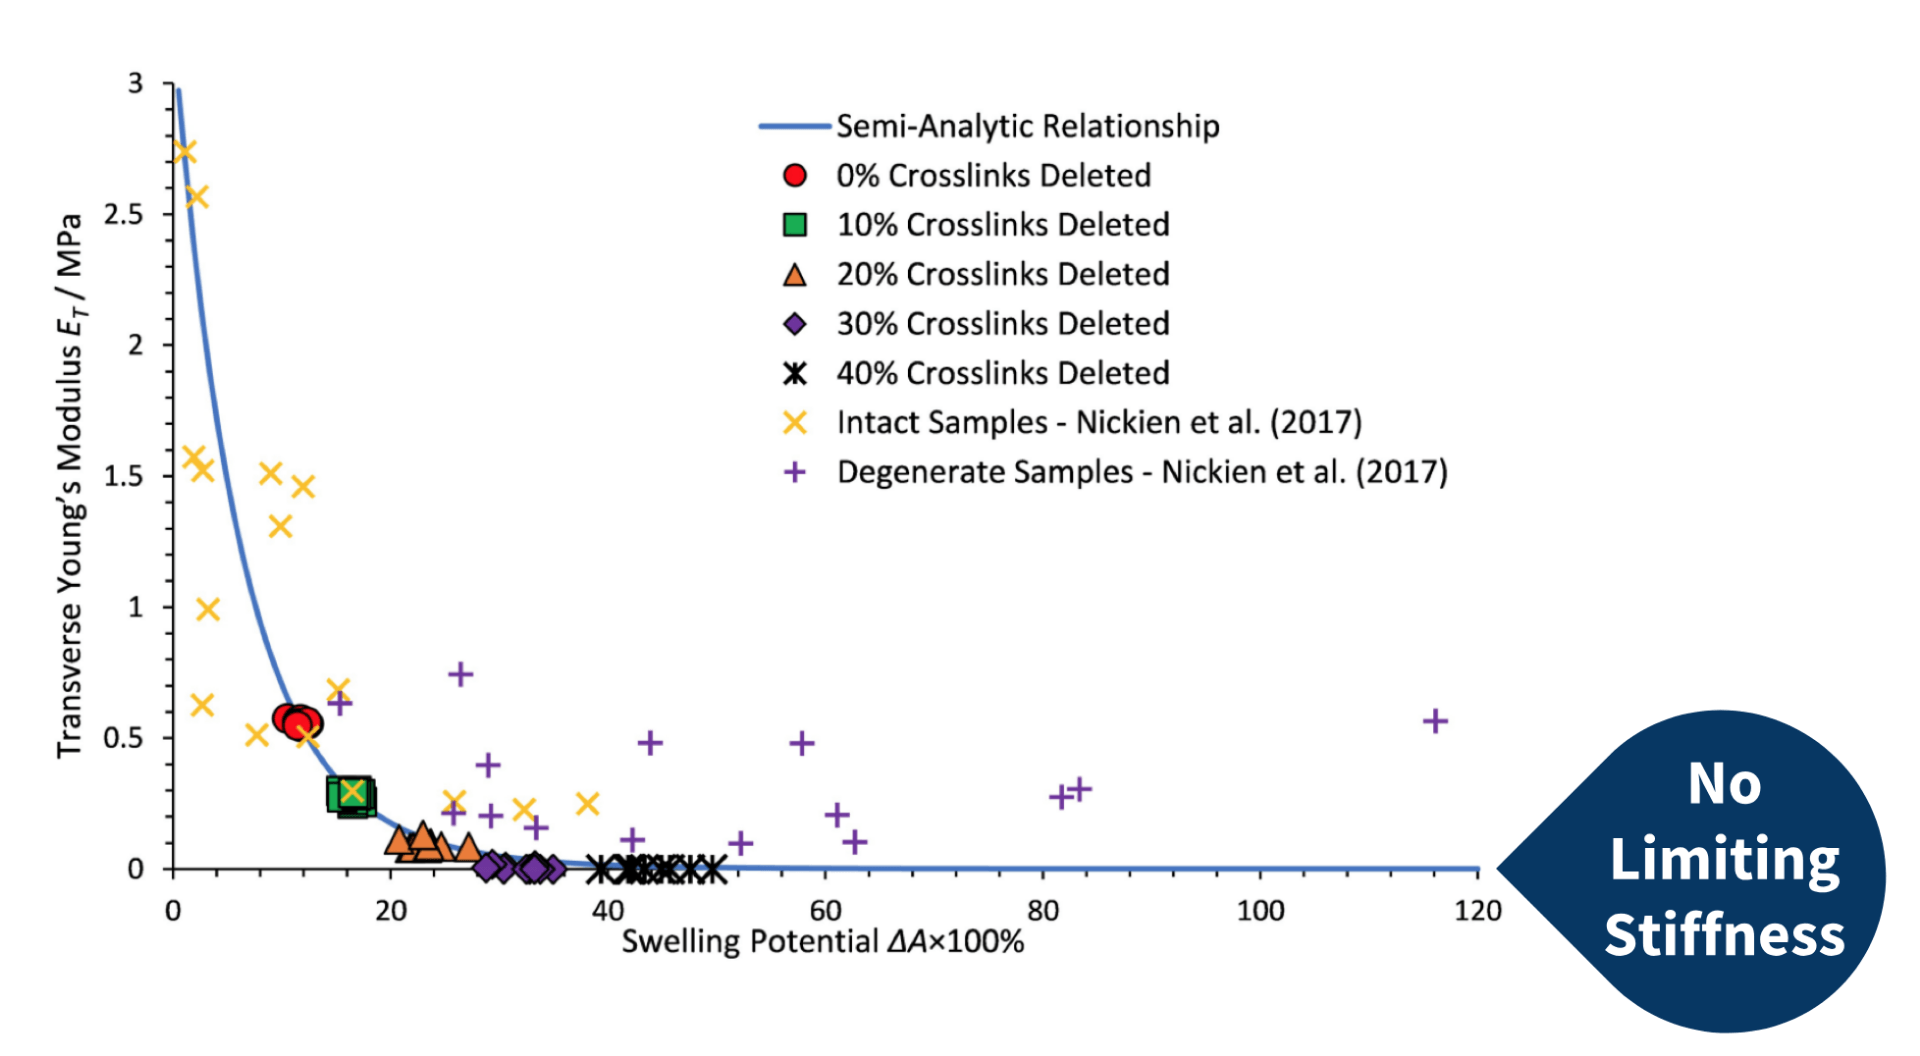
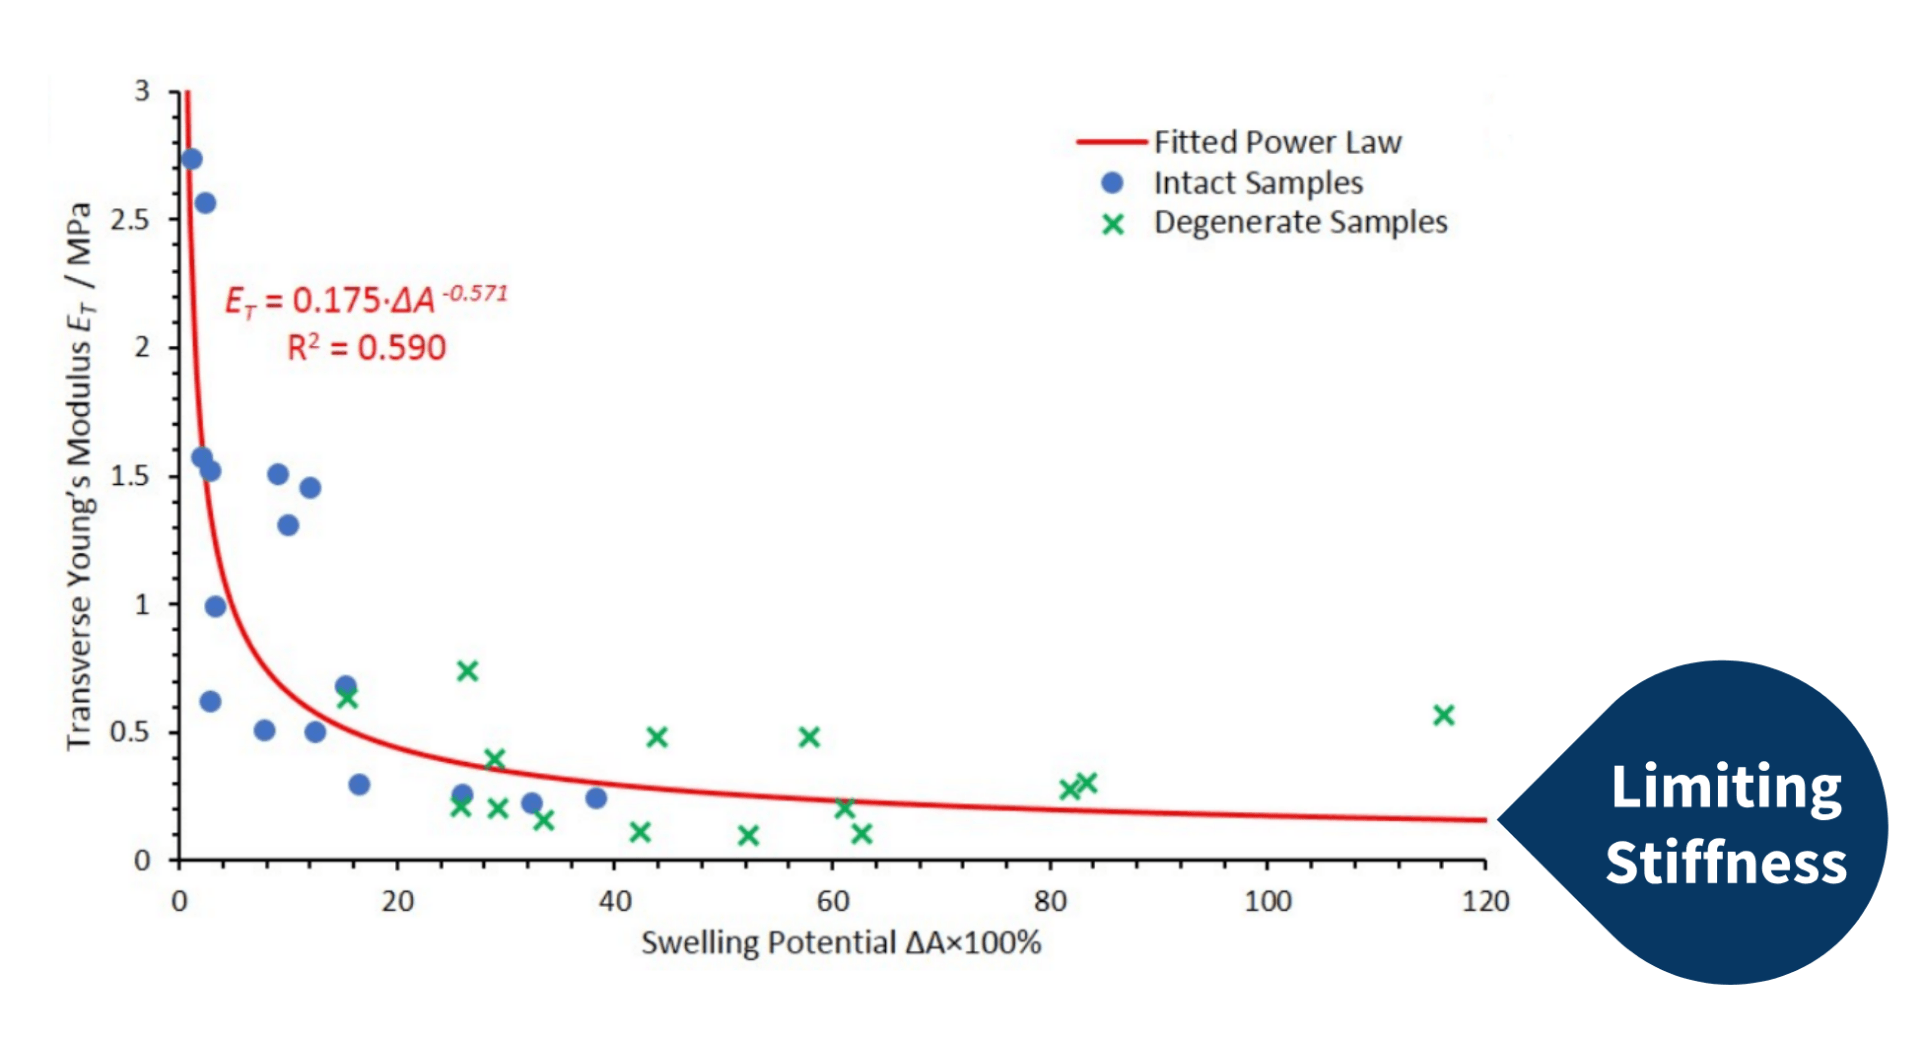
During a recent study, Bilton et al. (2018) produced a computational fibre-network model to assimilate the experimental data obtained by Nickien et al. (2017). Although the computational network generated by the model followed the same inverse relationship between swelling potential and transverse stiffness with varying crosslink density, the limiting stiffness present in the experimental data was absent in the computational model (as seen to the left). Instead, the computational model decayed to 0 MPa.
The decrease in interconnectivity observed during the initial stages of cartilage degeneration was modelling by Bilton et al. (2018) as changes in crosslink density. Bilton et al. (2018) concluded in their study that the absence of the limiting stiffness arose from the absence of re-aggregation factored in the model.
The Aims
The aim is to expand on the existing model created by Bilton et al. (2018) to more closely mimic the trends observed in Nickien et al.’s (2017) experimental data. By changing the network geometry of the model, the goal is to produce a network which exhibits the limiting stiffness present in the experimental data.
Model Development
The Regular Network
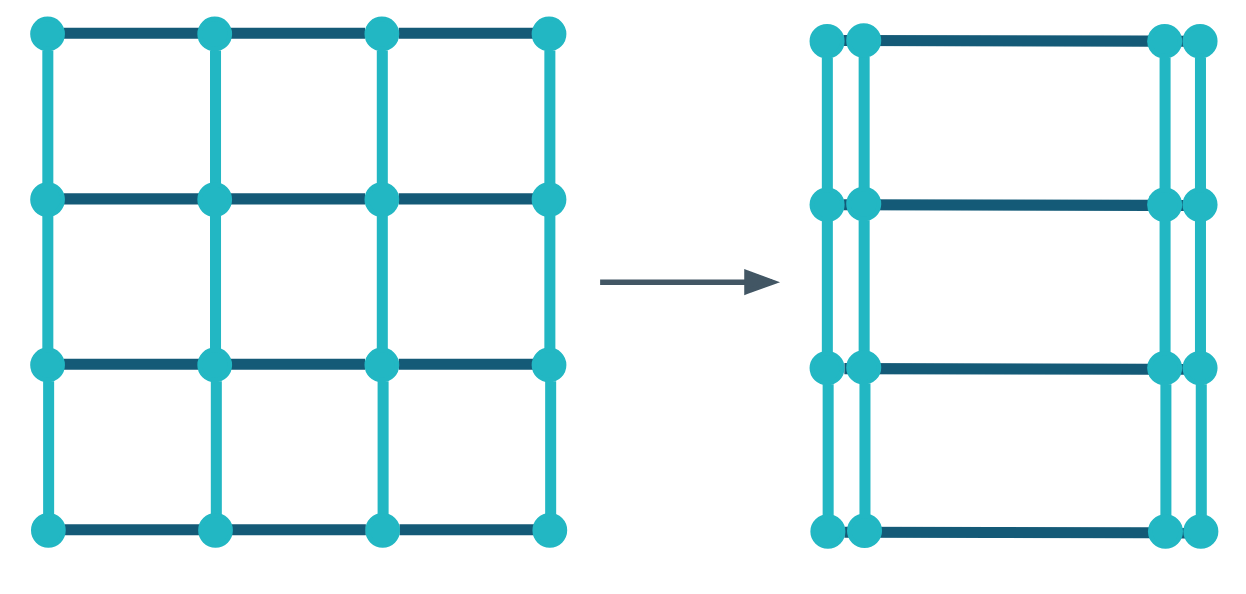
‘The regular network’ refers to the network produced by the model created by Bilton et al. (2018). As a fibre-network model, it is comprised of links and nodes. The links positioned in the radial direction represent the collagen fibrils, whereas the links positioned horizontally or in the transverse direction represent the crosslinks.
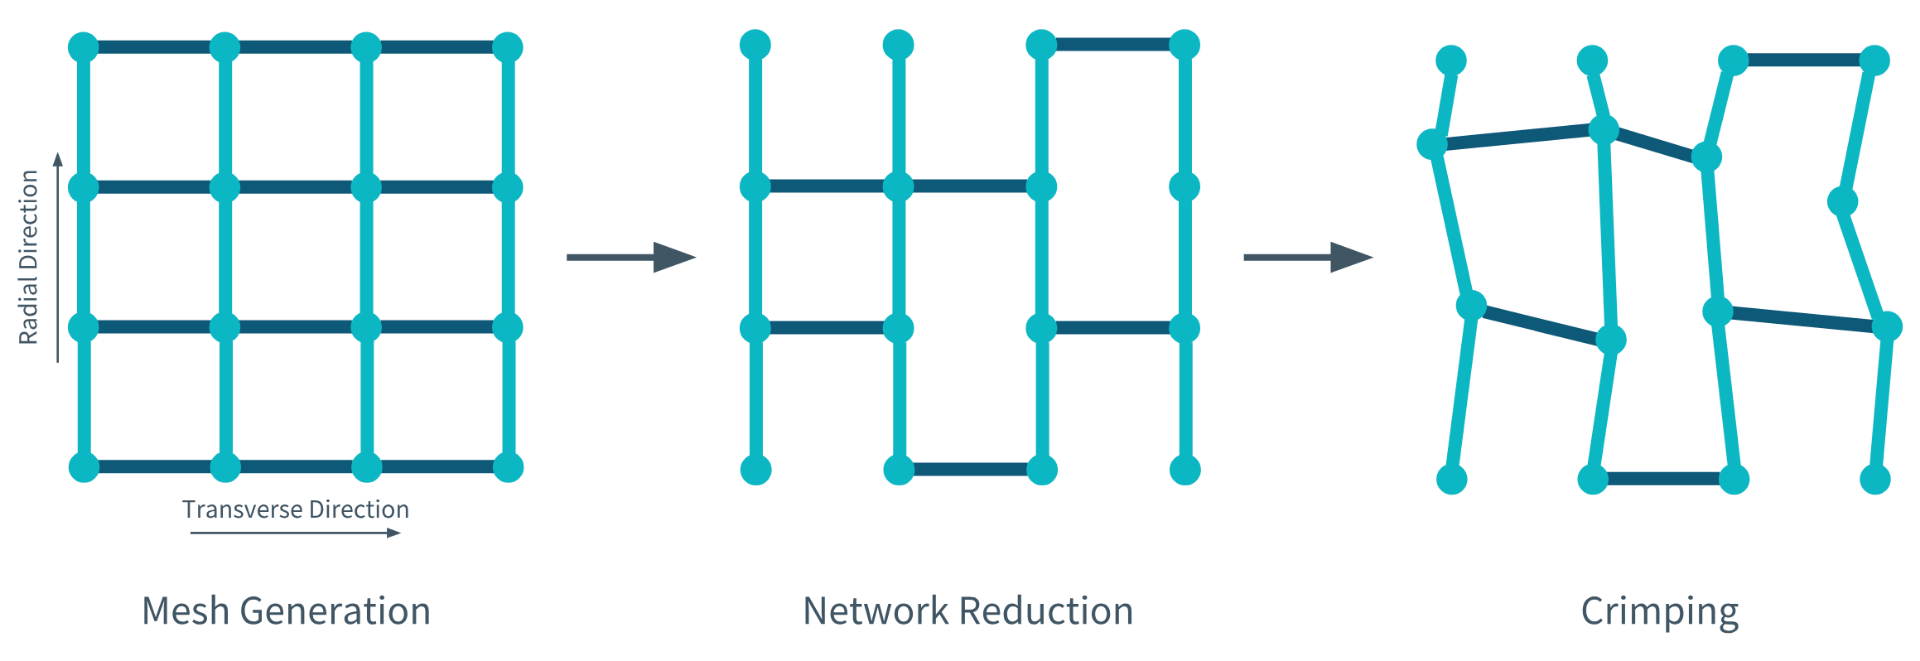 Bilton et al.’s (2018) computational model is produced in three steps. During the first step, the mesh is generated by connecting the nodes and links. During the second step, a specific percentage of crosslinks are removed from the model to simulate either degenerate or intact cartilage. During the final step, which is optional, the nodes are displaced irregularly to make the network appear more ‘cartilage-like.’
Re-aggregation
Bilton et al. (2018) believed the process of re-aggregation was responsible for the limiting stiffness observed in the experimental data obtained by Nickien et al. (2017). As a result, this was the first model development that was considered.
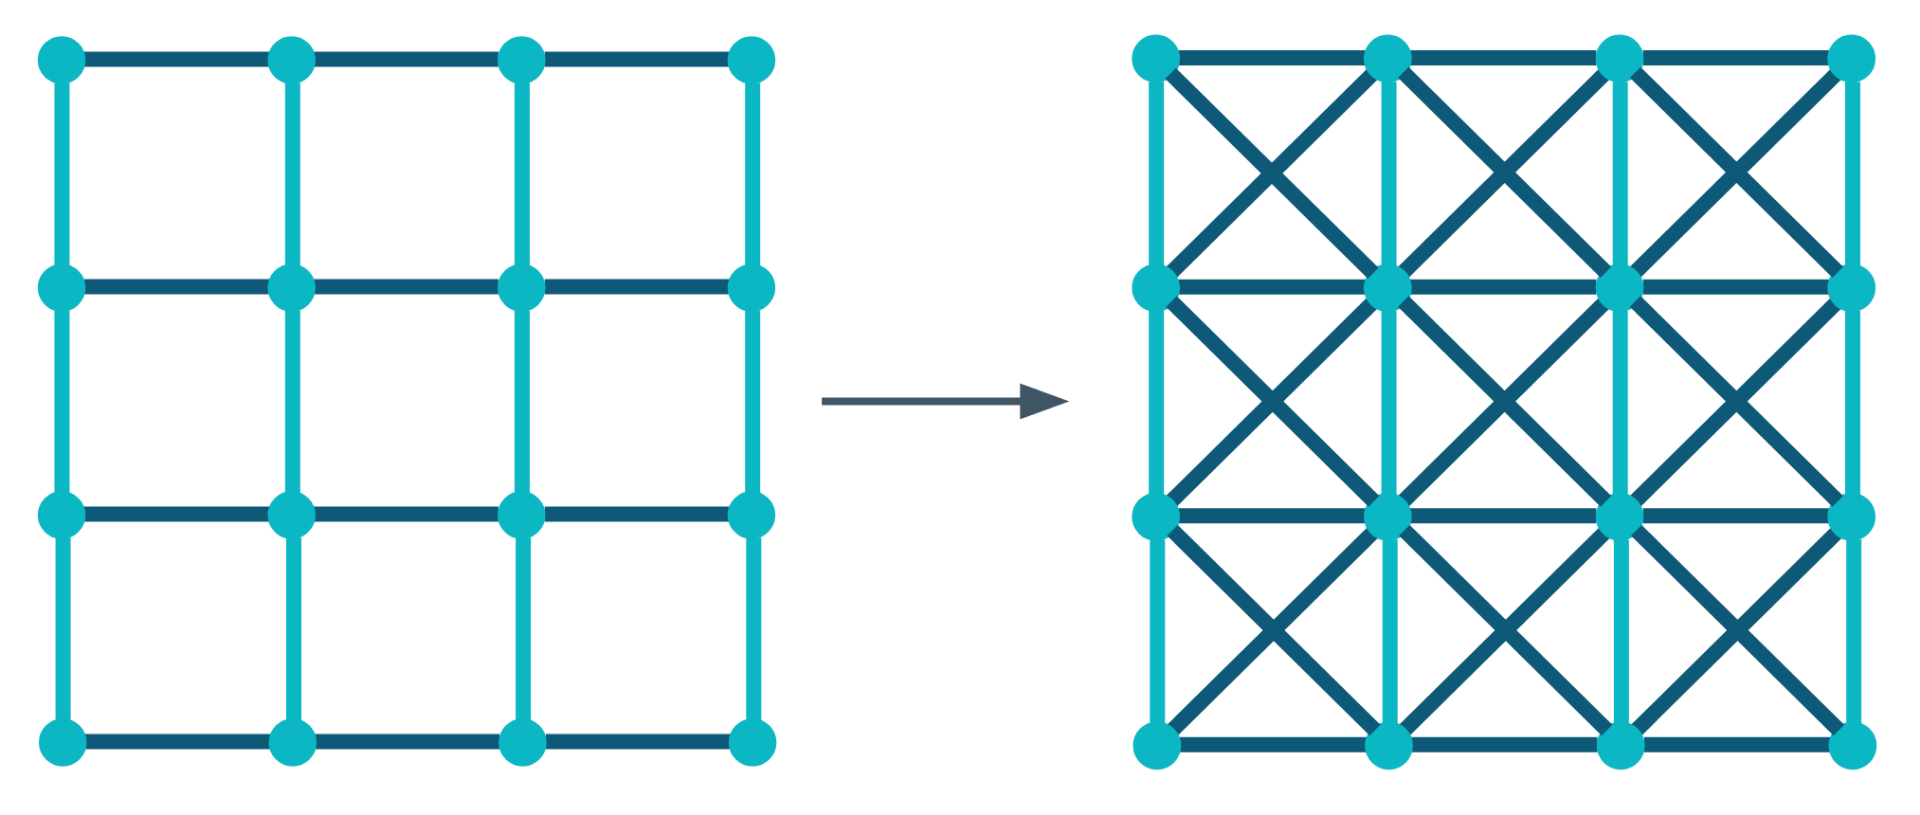
Diagonal Crosslinks
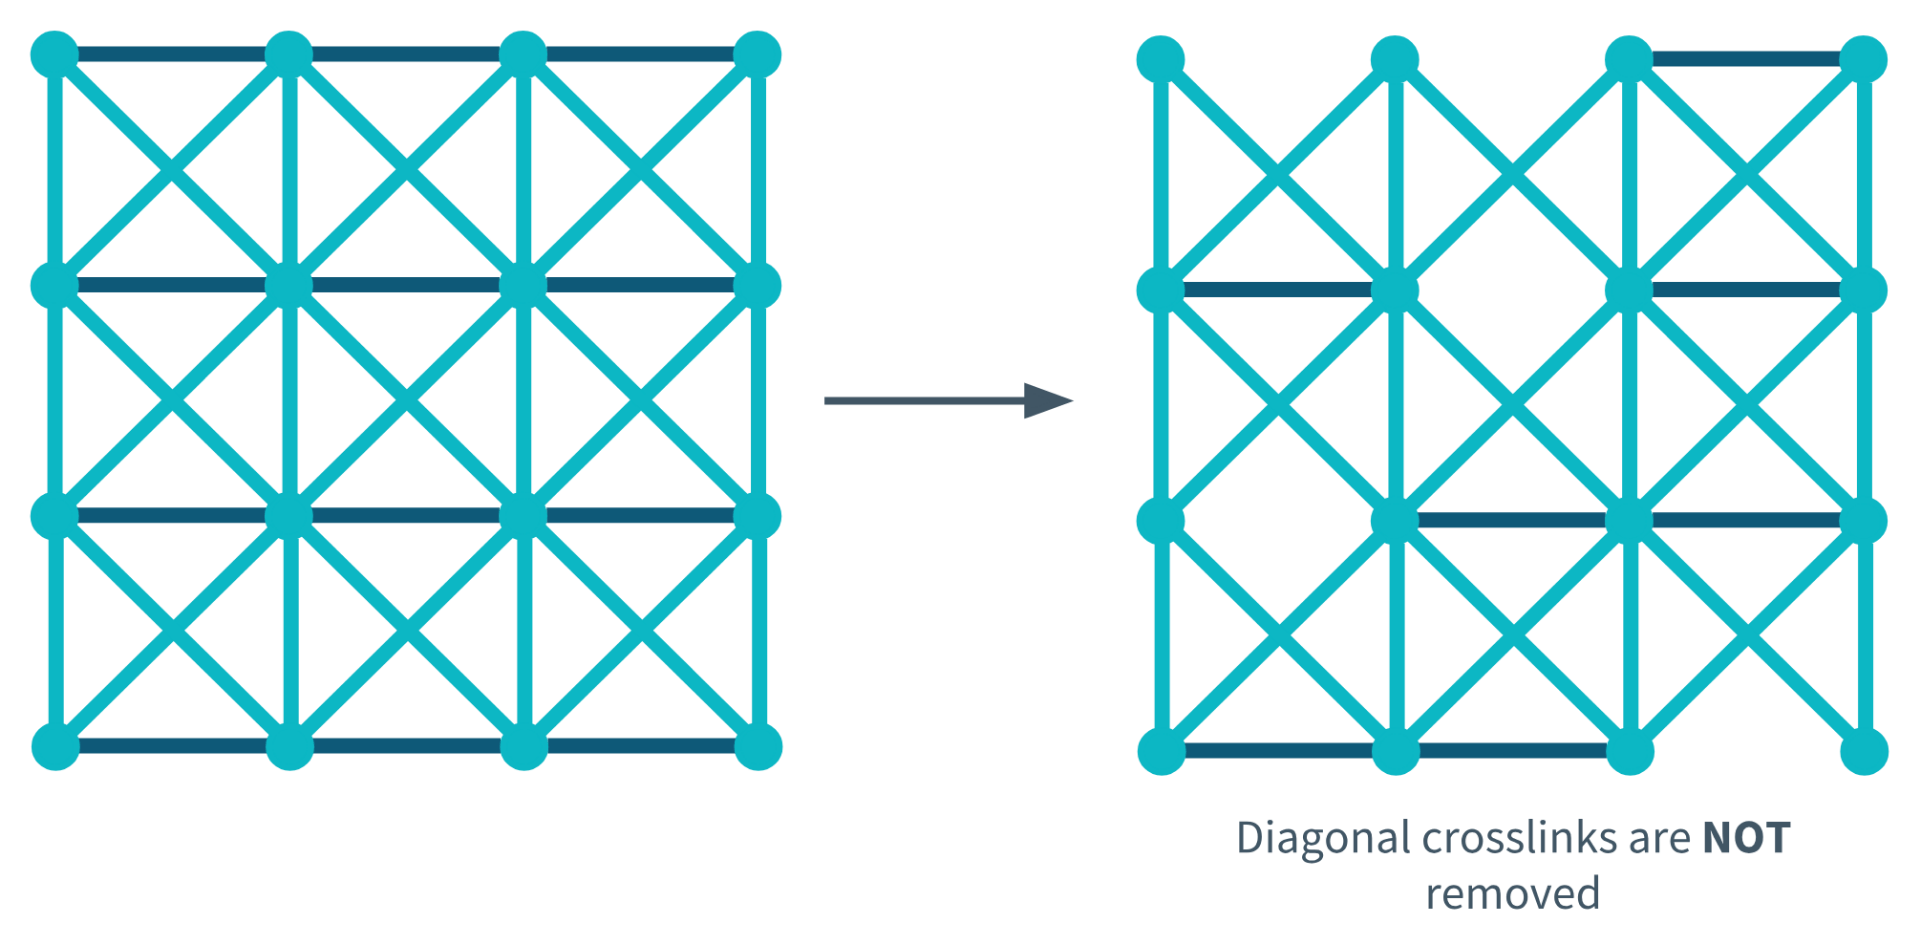
Diagonal Crosslink Not Removed During Degeneration
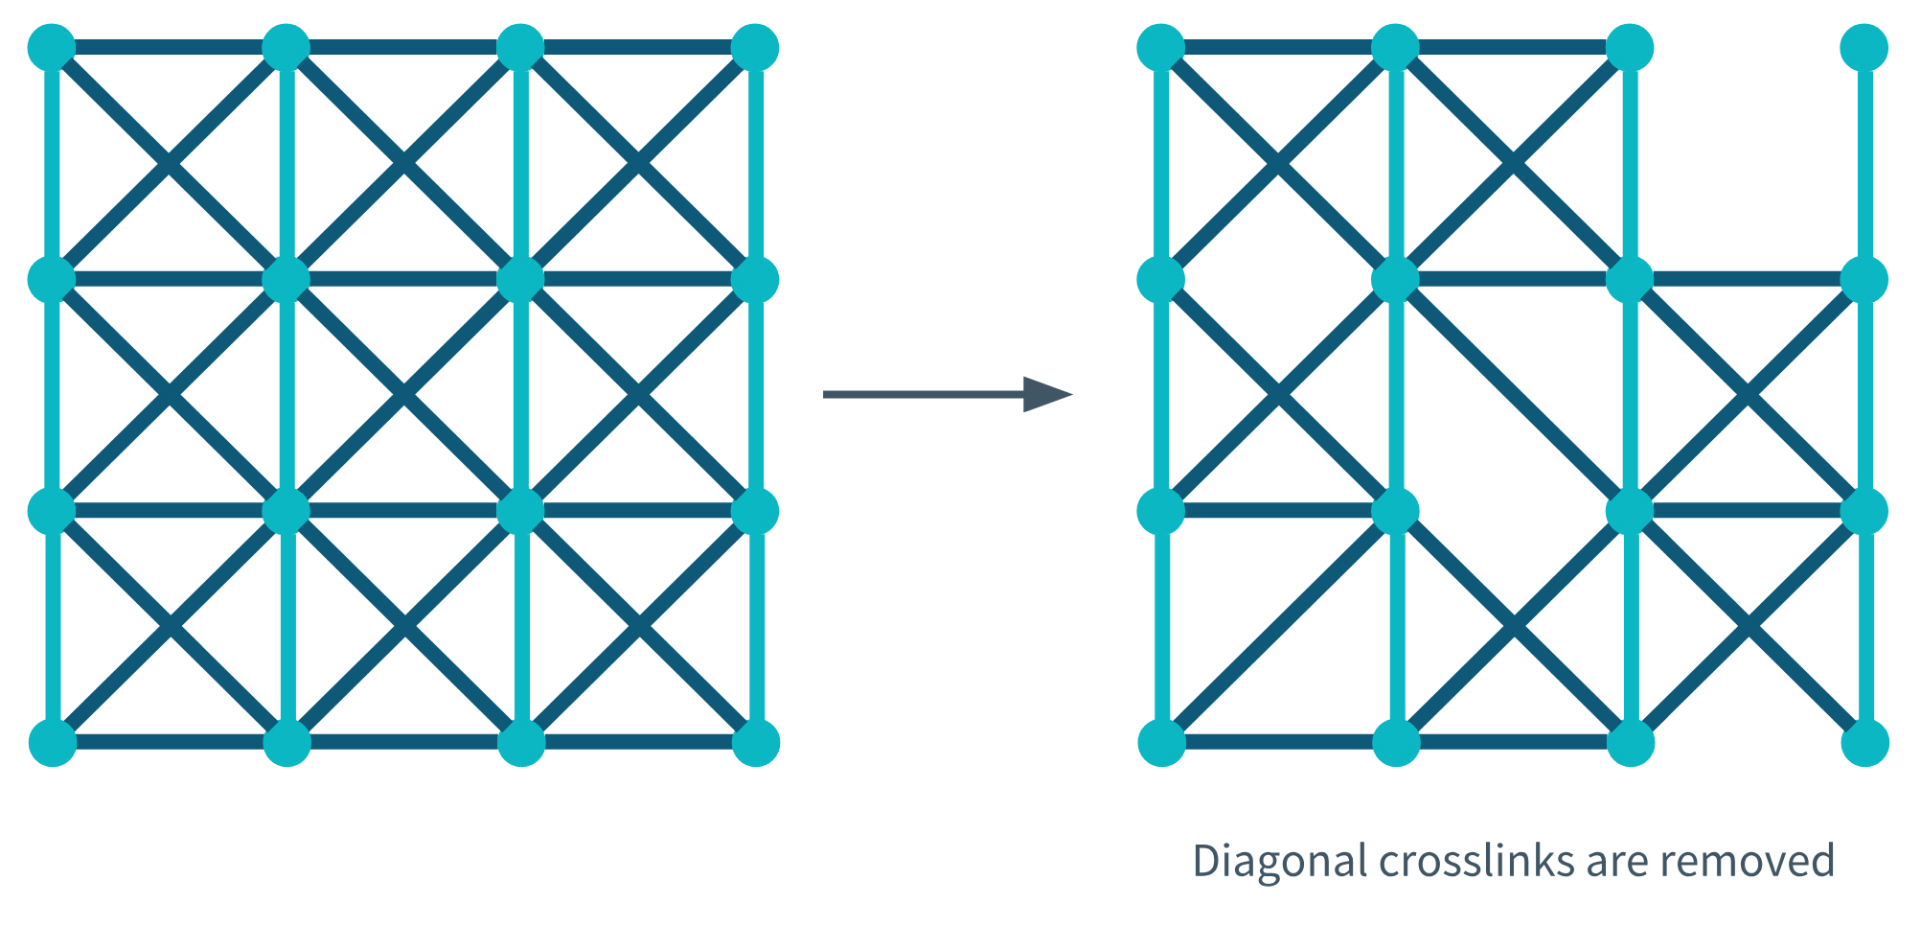
Diagonal Crosslinks Removed During Degeneration
Combined Network (Re-aggregation and Diagonal Crosslinks)
During the final stage of model development, a network was produced that incorporated both re-aggregation and diagonal crosslinks. The diagonal crosslinks were removable and therefore, degenerated with decreasing interconnectivity. The image below shows the structural changes made to the network before and after degeneration.
Results
Re-aggregated Network
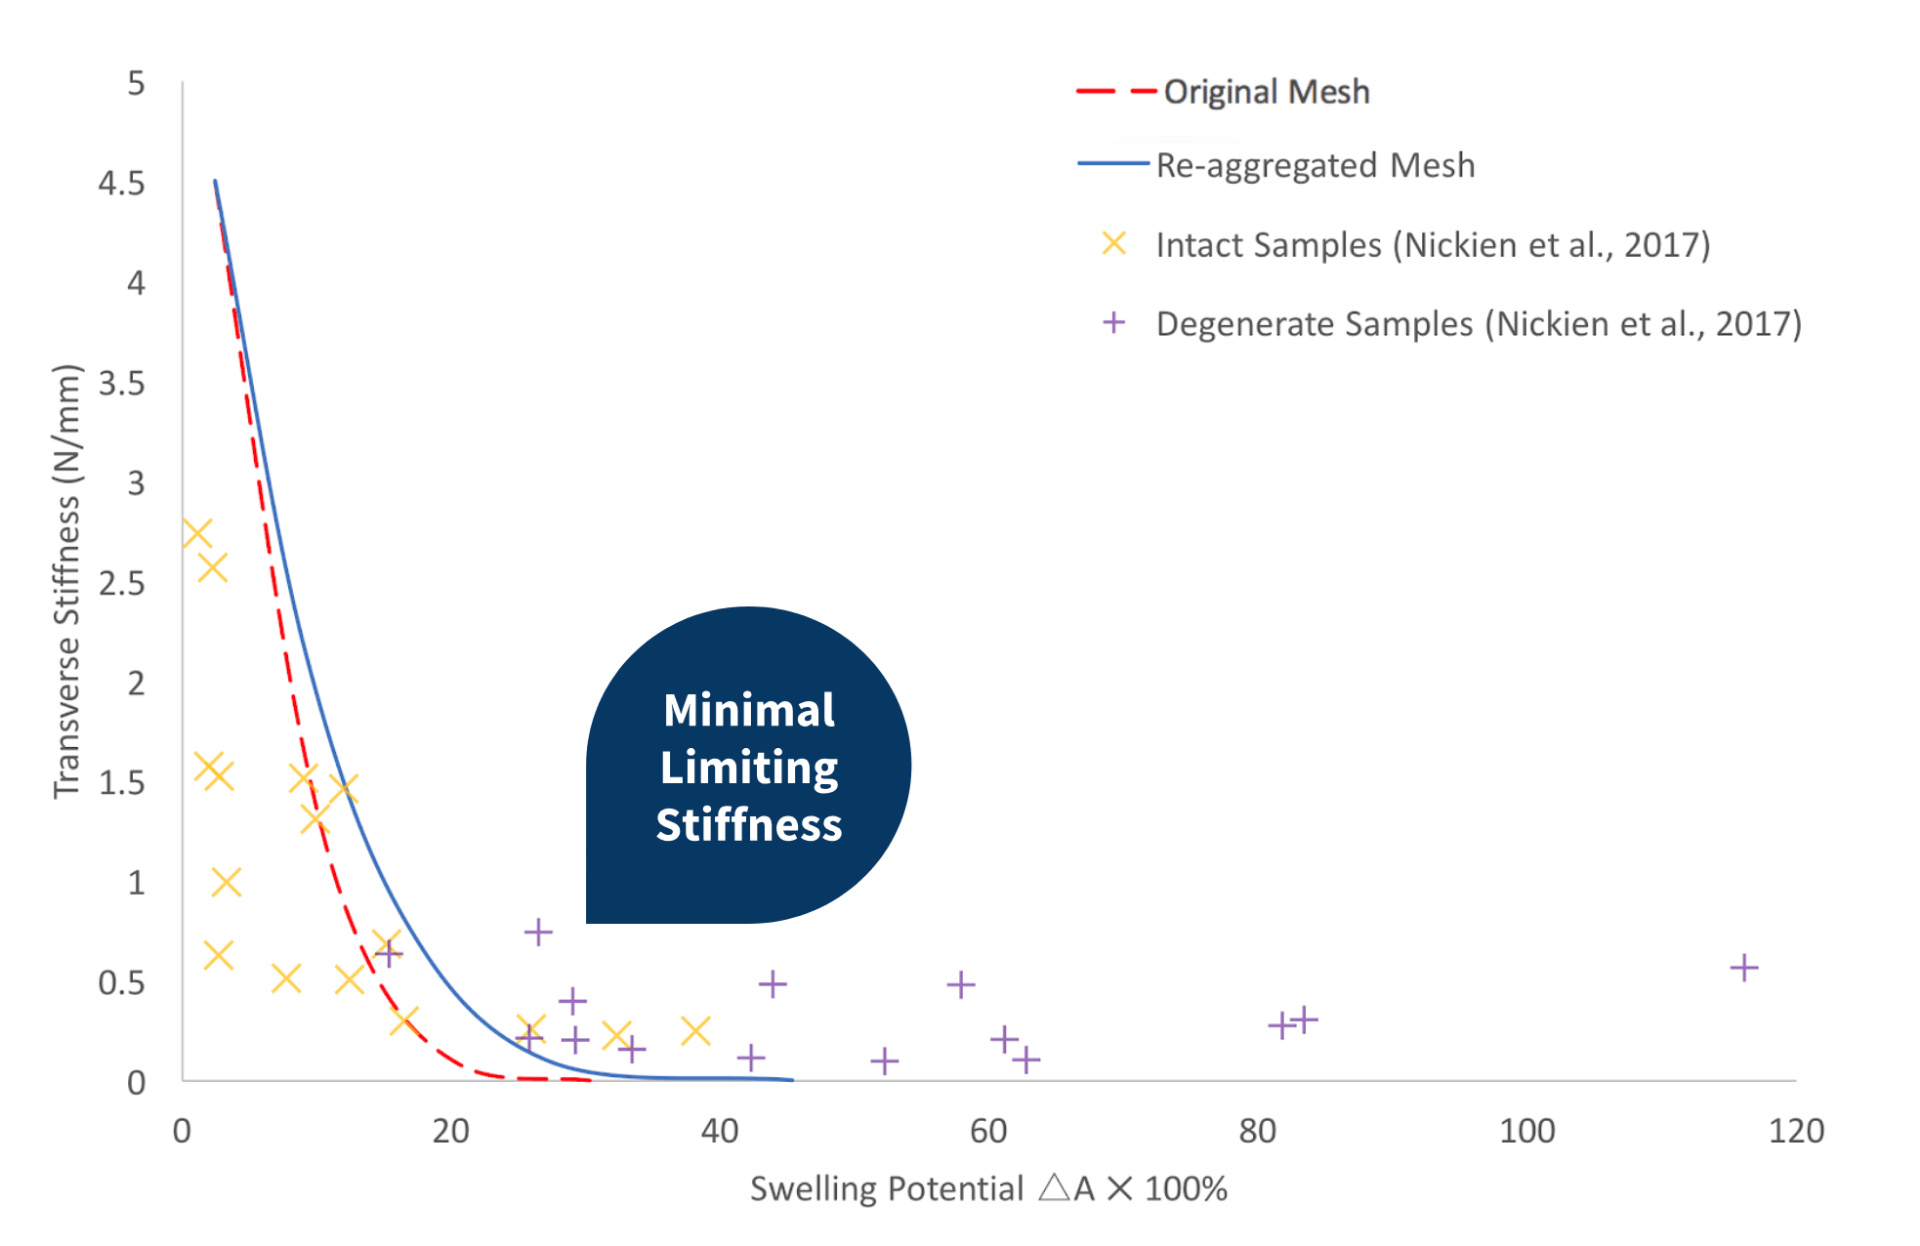
When plotting the mechanical properties for a re-aggregated mesh, the same inverse relationship between the transverse stiffness and the swelling potential was observed, as seen in both Nickien et al.’s (2017) experimental data and a replication of the original network created by Bilton et al. (2018). The re-aggregated network exhibits minimally greater limiting stiffness relative to the original network created by Bilton et al. (2018). Although, the curve over-predicts the maximum transverse stiffness and under-predicts the minimum swelling potential.
Network With Intact Diagonal Crosslinks
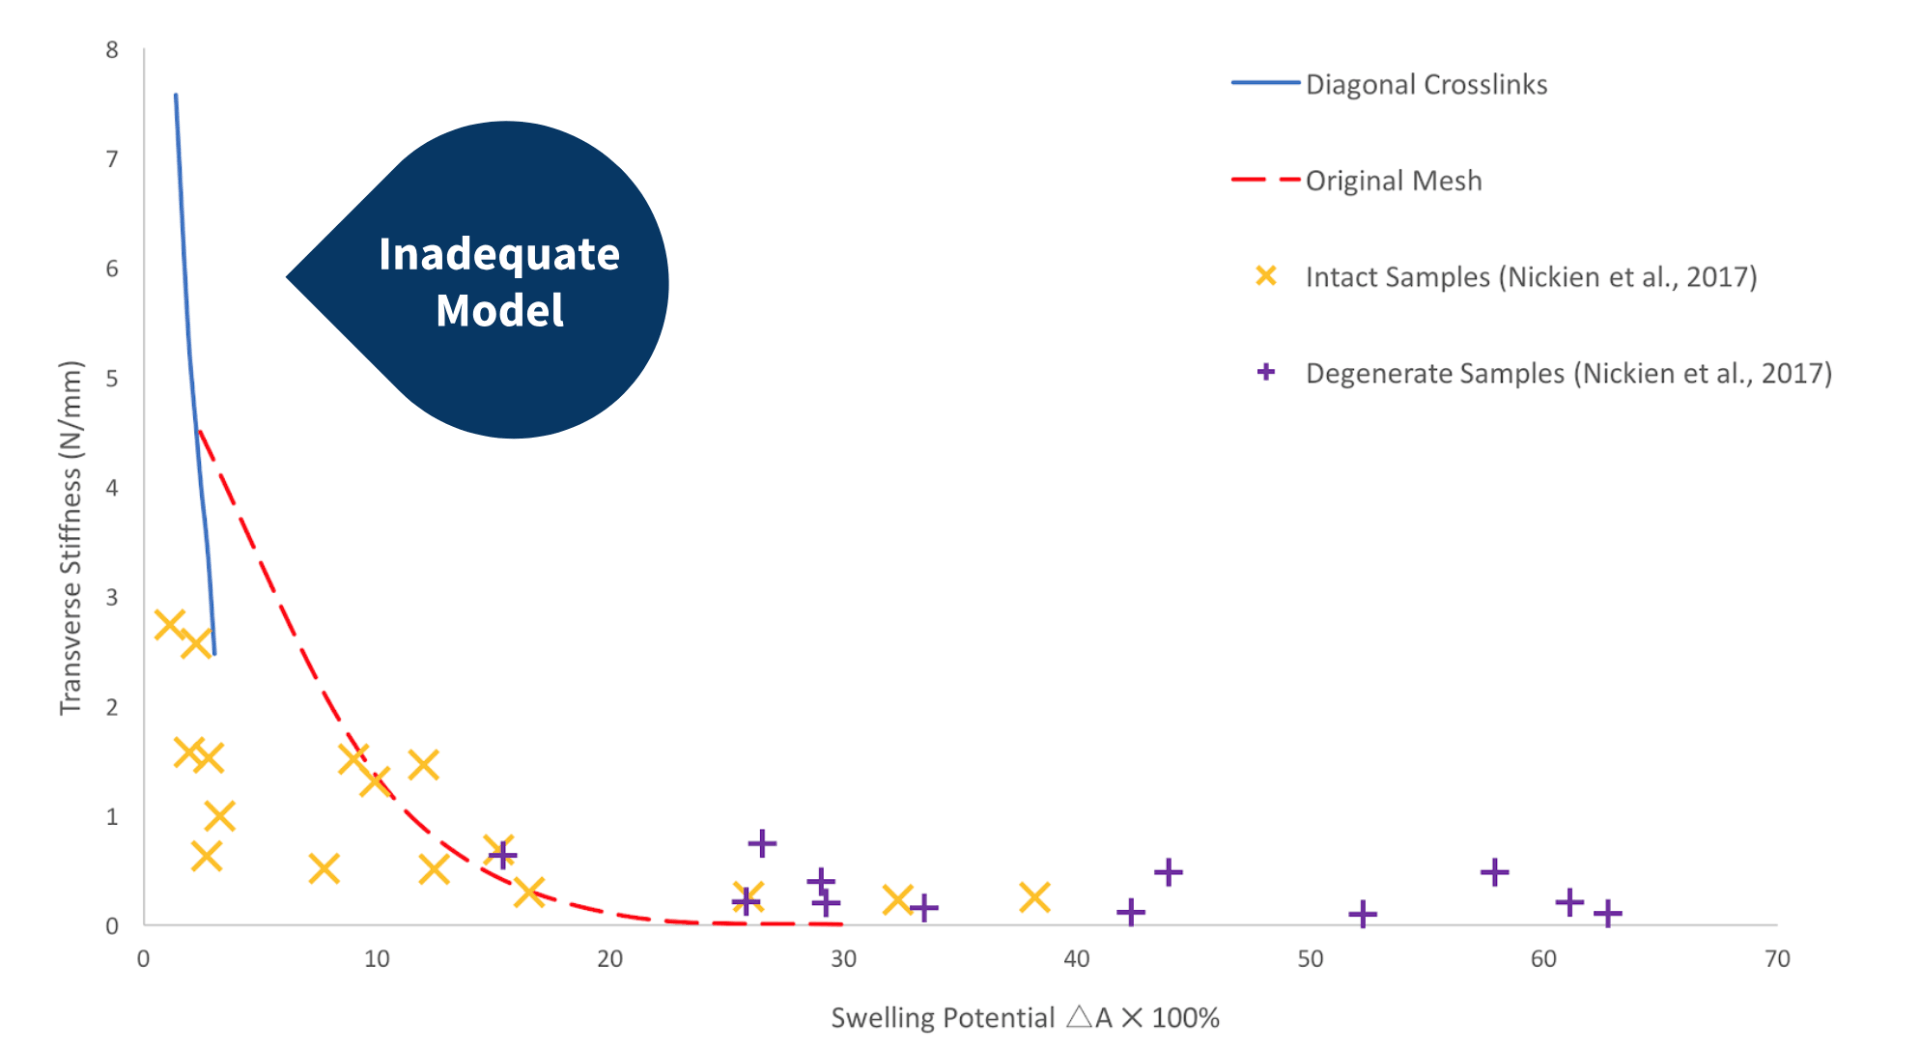
The graph on the left compares the results obtained from a network with intact diagonal crosslinks, the original network produced by Bilton et al. (2018), and the experimental data obtained by Nickien et al. (2017). It is clear from the graph that this network does not provide an accurate representation of the experimental data. The bracing provided by the additional diagonal crosslinks produces a very stiff network.
Network with removable Diagonal Crosslinks
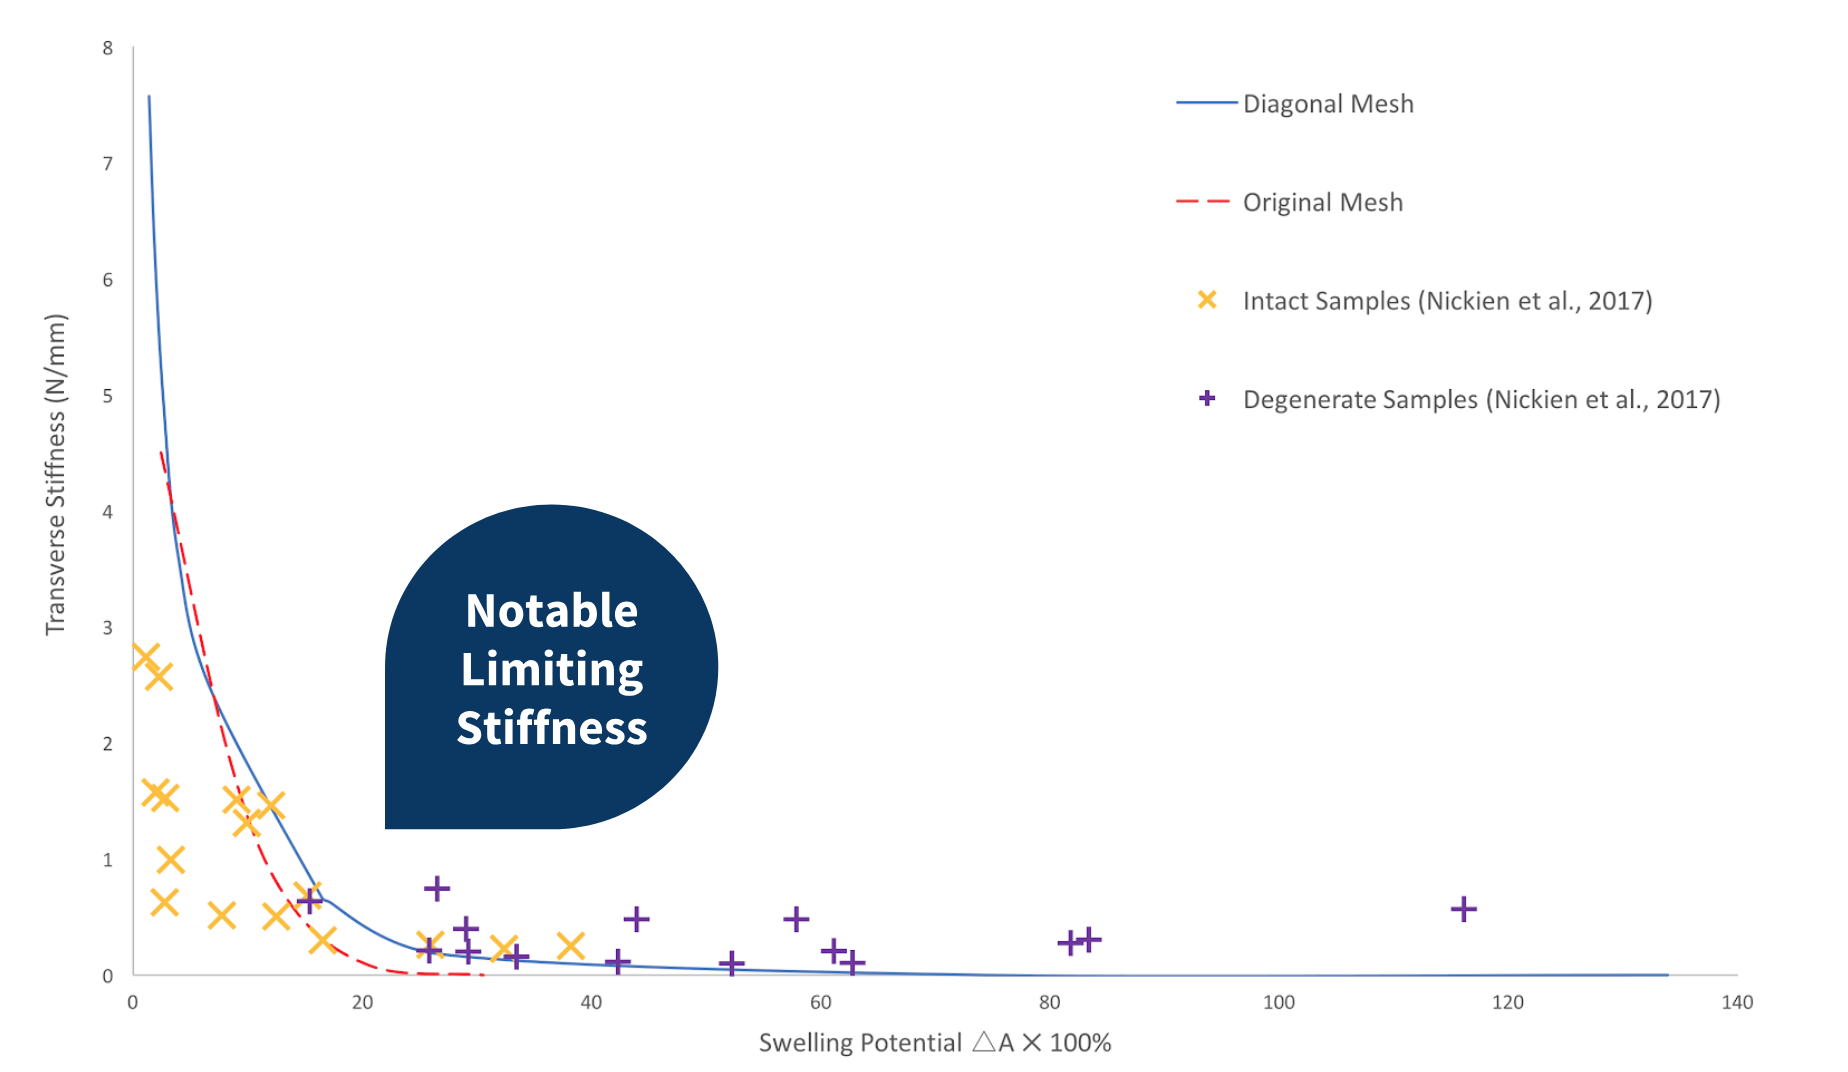
When the diagonal crosslink are removed from the network with decreasing crosslink density, a notable limiting stiffness is observed as the swelling potential increases. This network more closely assimilates the cartilage behaviour observed in the experimental data. As can be observed in the previous graphs, this network also tends to over-predict the transverse stiffness of the model at low swelling potentials.
Network That Combines Re-aggregation and Diagonal Crosslinks
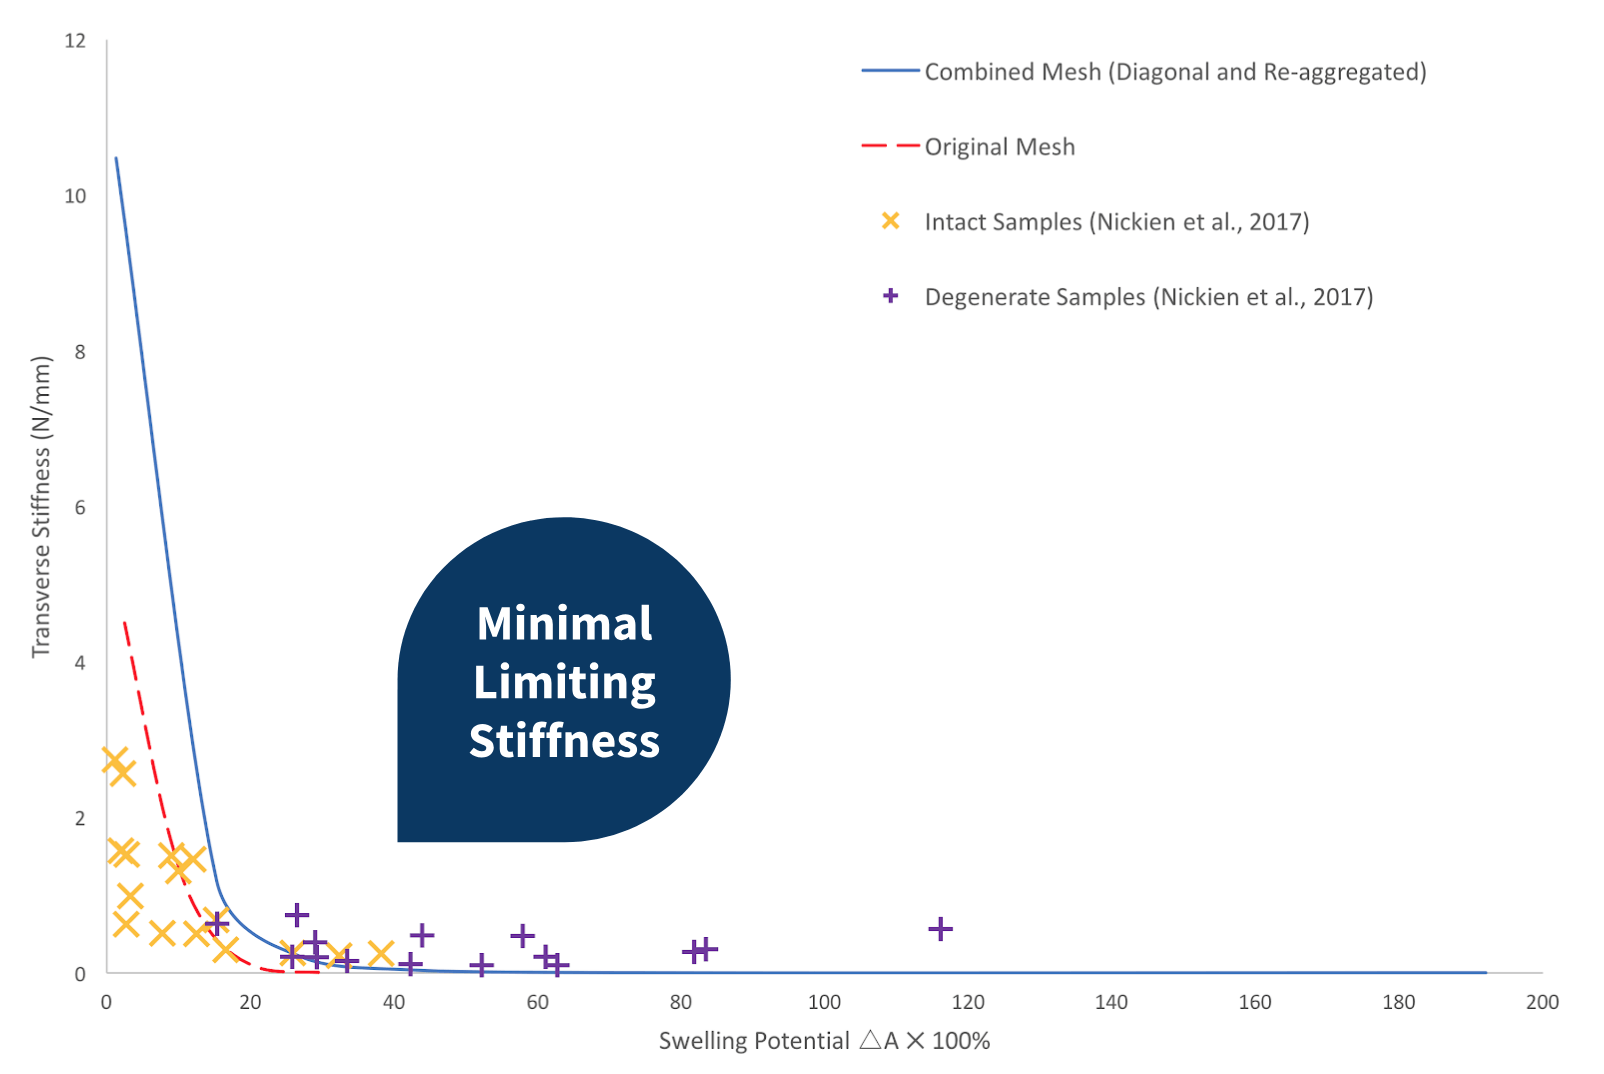
When the network incorporates both diagonal crosslinks and re-aggregation, the transverse stiffness at low swelling potentials was considerably over-predicted. Contrarily, when compared with the computed data obtained from the original network, the new model gives rise to a more notable limiting stiffness, although the trend is minimal compared to the experimental data.
Conclusions
As the model was developed, structural changes were made. From the results, it is clear that changes in the network can influence the mechanical properties of the model. Although all the models displayed a decrease in transverse stiffness with increasing swelling potential, the degree of limiting stiffness present in each graph varies. Removable diagonal crosslinks were incorporated into the model and provides the best fit with the experimental data. A notable limiting stiffness was present. Although, further development is required to more closely assimilate the experimental data.
Image Attributions
Medscape. https://www.medscape.com/viewarticle/860542
Prolotherapy. http://www.prolotherapy.org/wp-content/uploads/Knee-cartilage-1-905×509.jpg
THRIVE MD. https://thrivemdvail.com/achieving-cartilage-regeneration-fat-derived-stem-cells-vs-bone-marrow/
Indiana Polyclinic. https://indianapolyclinic.com/stem-cell-treatment-program/kb/stem-cell-therapy-for-knees
Kinnunen. http://epublications.uef.fi/pub/urn_isbn_978-952-61-0908-4/urn_isbn_978-952-61-0908-4.pdf
Arthritis Statistics. https://www.arthritis.org/Documents/Sections/About-Arthritis/arthritis-facts-stats-figures.pdf
References
